
Highlights
- Recession is expected in the euro area and the UK as we head into 2024.
- Some portfolios are designed to deliver value through different phases of the economic cycle.
- A strategic allocation to global equities and global bonds that aligns with a client's investment horizon and attitude towards risk can deliver long-term value.

The euro area and the UK economies are slowing down and both markets look on course to enter recession (the euro area may already be in one) as we head into 2024. The outlook might be concerning to some, but there are portfolios designed to deliver value throughout the different phases of the economic cycle.
Long-term investors will experience various economic and market conditions throughout their investment journey, which is why it's practical to construct portfolios that can withstand economic downturns as well as capture returns when markets are rising. Such strategies are sometimes referred to as ‘all-weather' portfolios.
Understanding the typical behaviour of different investments through the economic cycle is key to building all-weather portfolios—and with recession looming, it seems a good time to revisit the fundamentals of investing for the long term.
In this article, we explore the historical patterns of asset class returns at different points of the economic cycle with a view to constructing portfolios that deliver enduring value for clients.
Equities drive returns during growth phases
Building an all-weather portfolio hinges on investors accepting the risk/reward trade-off of different investments and the cyclical nature of economies and markets. The most obvious way market dynamics are considered in portfolio construction is through a strategic allocation1 to global equities and global bonds.
That's because, put simply, stock markets tend to outperform bonds when the economy is growing and business conditions are favourable, while bond prices tend to rise when the economy contracts (or is expected to)—or at least when stock markets fall for a sustained period of time.
The chart below is based on US data, but the findings are relevant across global markets—that stock markets tend to drive market returns when the economy is expanding. Global equities posted an annualised return of almost 12% (in US dollar terms) in non-recessionary environments between January 1988 and the end of December 2022, with global bonds returning an average of 5.1% in those periods.
Average asset class returns in non-recessionary conditions
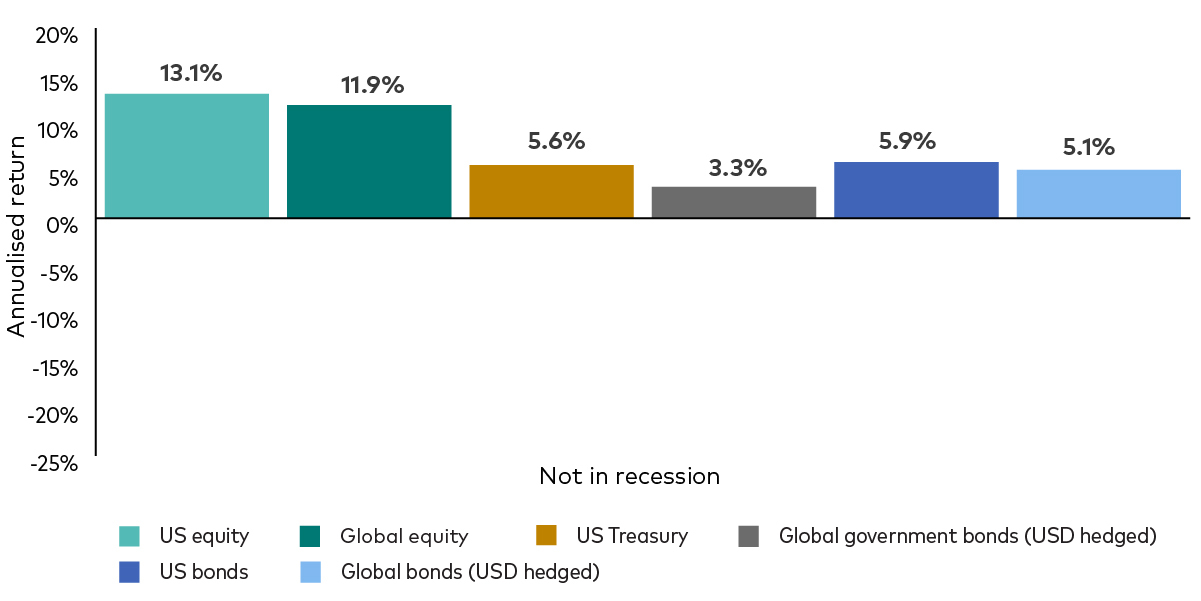
Past performance is not a reliable indicator of future results.
Source: Bloomberg and St. Louis FRED database. Notes: Monthly data from December 1969, or when the index was first available, to December 2022. US equities are represented by the MSCI USA Index starting December 1969; global equities by the MSCI AC World Index starting December 1987; US Treasury bonds by the Bloomberg U.S. Treasury Bond Index starting January 1973; global government bonds by the Bloomberg Global Government Bond Index starting September 2000; US bonds by the Bloomberg U.S. Aggregate Bond Index starting January 1976; and global bonds by Bloomberg Global Aggregate Bond Index starting January 1990. All returns in USD without income reinvested. Recession periods per the definition of the National Bureau of Economic Research (NBER).
Global bonds tend to outperform equities during recessions
In a recession (as defined by the National Bureau of Economic Research), the picture changes significantly, as illustrated in the next chart, which shows that bonds tend to outperform equities during recessions.
The rise of bond markets during periods of economic weakness reflects a trend often referred to as a ‘flight to quality' or ‘flight to safety' as investors seek the relative safety and reliability of high-quality fixed income.
Asset class performance during recessions
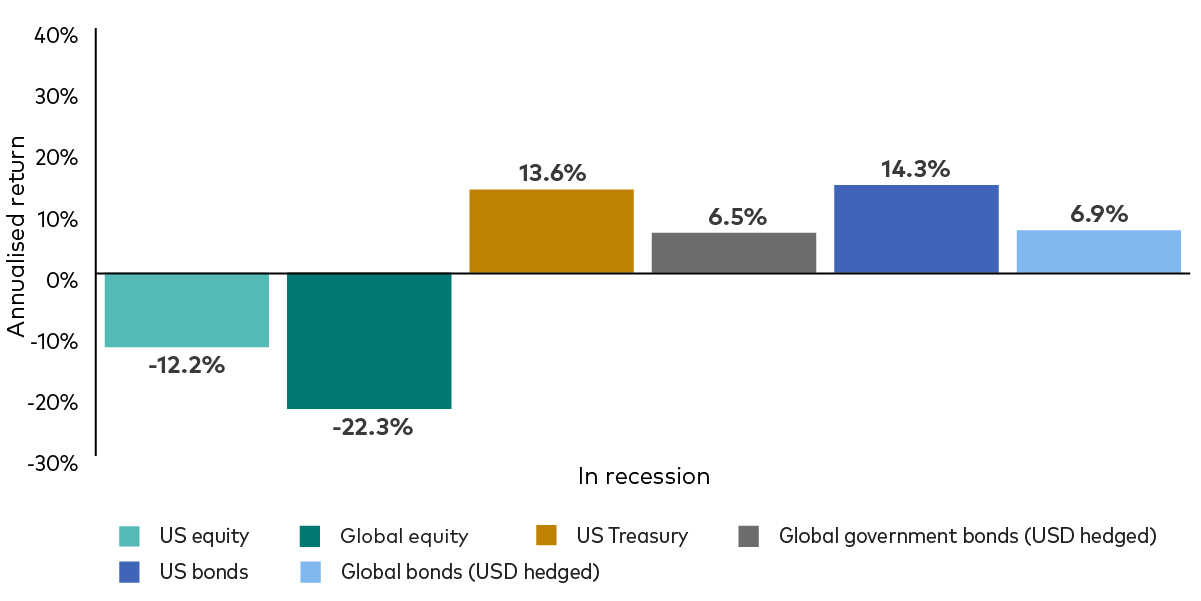
Past performance is not a reliable indicator of future results.
Source: Bloomberg and St. Louis FRED database. Notes: Monthly data from December 1969, or when the index was first available, to 31 December 2022. US equities are represented by the MSCI USA Index starting December 1969; global equities by the MSCI AC World Index starting December 1987; US Treasury bonds by the Bloomberg U.S. Treasury Bond Index starting January 1973; global government bonds by the Bloomberg Global Government Bond Index starting September 2000; US bonds by the Bloomberg U.S. Aggregate Bond Index starting January 1976; and global bonds by Bloomberg Global Aggregate Bond Index starting January 1990. All returns in USD without income reinvested. Recession periods per the definition of the National Bureau of Economic Research (NBER).
Some observers might see the findings as encouragement to shift their clients' asset allocations towards fixed income at the expense of equity market exposure when a recession is looming, but a key point to note is that our analysis benefits from hindsight. In other words, we don't know exactly when a recession will start or finish until several months after the fact, making market timing incredibly difficult - and risky.
Stock markets rally before a recession ends and then outperform
Another reason investors should beware abandoning stock markets during a downturn is that our research found global equities tend to recover before a recession ends2.
In each of the seven US recessions between 1973 and 2021, we found that the S&P 500 began to recover, in US dollar terms, while the economy continued to shrink.
We also analysed the timing of equity market rallies during the same period and found little observable pattern. The earliest recessionary recovery in stocks began just two months into the brief economic downturn of 2020, while the latest recovery started 16 months into the recession of 2007-2009.
Even though the mid-recession rally may not be quite enough to bring the average equity return up during an economic downturn, the next chart shows how equities tend to compensate patient investors in the six months after the end of a recession. The data show that global equities returned an average of 27% (in US dollar terms) in the six months following a recession.
Post-recession stock market rebound
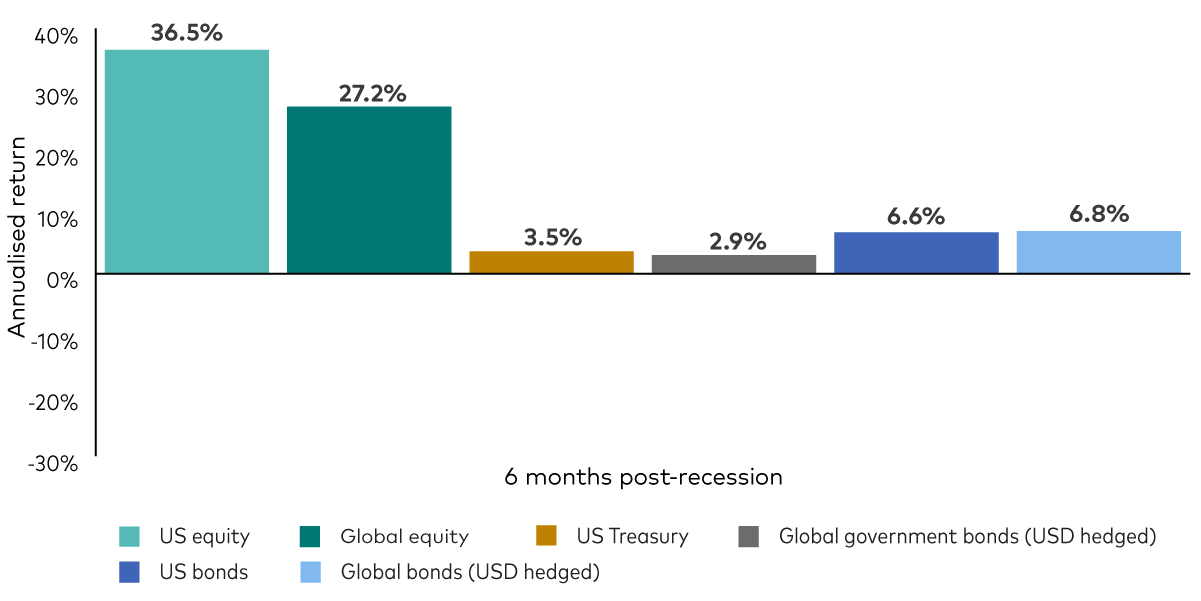 Past performance is not a reliable indicator of future results.
Source: Bloomberg and St. Louis FRED database. Notes: Monthly data from December 1969, or when the index was first available, to 31 December 2022. US equities are represented by the MSCI USA Index starting December 1969; global equities by the MSCI AC World Index starting December 1987; US Treasury bonds by the Bloomberg U.S. Treasury Bond Index starting January 1973; global government bonds by the Bloomberg Global Government Bond Index starting September 2000; US bonds by the Bloomberg U.S. Aggregate Bond Index starting January 1976; and global bonds by Bloomberg Global Aggregate Bond Index starting January 1990. All returns in USD without income reinvested. Recession periods per the definition of the National Bureau of Economic Research (NBER).
The key message from this analysis, we think, is that rather than trying to time markets, investors are often rewarded by being patient and maintaining a strategic allocation to global equities and global bonds throughout their investment journey.
The importance of broad market diversification
A key component of an effective all-weather portfolio is broad diversification across global equity and bond markets. By spreading investments across regions and sectors, investors can reduce risk while capturing gains from the best-performing securities at any given period.
As the data below highlight, it's difficult to say exactly which sub-asset class across equity and bond markets will perform well from year to year. We only need to look at the results of 2022 to consider the dangers of concentrating investments in one region or sector, with UK equities the only asset class to deliver a positive return last year (in GBP terms).
Key bond and equity index returns (%), ranked by performance
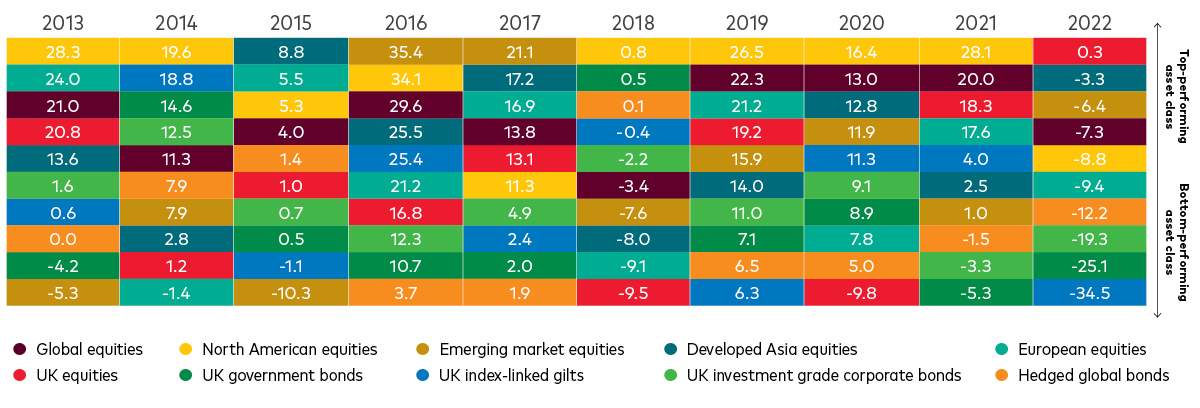
Past performance is not a reliable indicator of future results.
Source: Vanguard calculations, data from 1 January 2013 to 31 December 2022, using data from Barclays Capital and Thompson Reuters Datastream and FactSet. Global equities as the FTSE All World Index, North American equities as the FTSE World North America Index, Emerging market equities as the FTSE All-World Emerging Index, Developed Asia equities as the FTSE All World Developed Asia Pacific Index, European equities as the FTSE All World Europe ex-UK Index, UK equities is defined as the FTSE All Share Index, UK government bonds as Bloomberg Sterling Gilt Index, UK index-linked gilts as Bloomberg UK Govt Inflation-Linked UK Index, UK investment grade corporate bonds as Bloomberg Sterling Aggregate Non-Gilts - Corporate Index, Hedged global bonds as Bloomberg Global Aggregate Index (hedged in GBP). Performance shown is cumulative and denominated in GBP. It includes the reinvestment of all dividends and any capital gains distributions.
Vanguard's multi-asset solutions are designed with a strategic allocation to global equities and global bonds which is broadly diversified across markets, with the aim of delivering value through various economic and market environments.
The key to unlocking the value of all-weather multi-asset portfolios is to find the most suitable asset allocation strategy, based on each client's attitude towards risk, their goals and investment horizon—and ultimately staying the course through the ups and downs of markets.
1Strategic asset allocation involves the deliberate division of investments across different asset classes to manage risk while targeting either a specific or broad long-term investment objective—and rebalancing the portfolio back to this pre-set allocation periodically. There are two primary approaches to strategic asset allocation: fixed-target allocation (steady), whereby the proportion invested in global equities and global bonds is consistent and maintained through regular portfolio rebalancing; and time-varying allocation (dynamic) whereby the mix of assets changes over time to optimise portfolio returns according to the portfolio's objective.
2Source: Bloomberg, as at 18 October 2022. Note: Monthly data from 1 January 1970 to 1 September 2022. Recession periods are National Bureau of Economic Research recessions. Performance is in USD and calculations include the reinvestment of all dividends and any capital gains distributions.
Vanguard economic and market outlook 2024: Global summary
Our 2024 outlook summary is available now.
Investment risk information
The value of investments, and the income from them, may fall or rise and investors may get back less than they invested.
Past performance is not a reliable indicator of future results.
Important information
For professional investors only (as defined under the MiFID II Directive) investing for their own account (including management companies (fund of funds) and professional clients investing on behalf of their discretionary clients). In Switzerland for professional investors only. Not to be distributed to the public.
The information contained in this document is not to be regarded as an offer to buy or sell or the solicitation of any offer to buy or sell securities in any jurisdiction where such an offer or solicitation is against the law, or to anyone to whom it is unlawful to make such an offer or solicitation, or if the person making the offer or solicitation is not qualified to do so. The information in this document does not constitute legal, tax, or investment advice. You must not, therefore, rely on the content of this document when making any investment decisions.
The information contained in this document is for educational purposes only and is not a recommendation or solicitation to buy or sell investments.
Issued in EEA by Vanguard Group (Ireland) Limited which is regulated in Ireland by the Central Bank of Ireland.
Issued in Switzerland by Vanguard Investments Switzerland GmbH.
Issued by Vanguard Asset Management, Limited which is authorised and regulated in the UK by the Financial Conduct Authority.
© 2023 Vanguard Group (Ireland) Limited. All rights reserved.
© 2023 Vanguard Investments Switzerland GmbH. All rights reserved.
© 2023 Vanguard Asset Management, Limited. All rights reserved.