Michael Wright, head of fixed income at LV Asset Management, explains how bond yield curves operate.
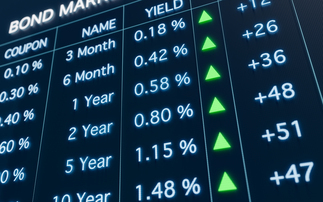
Q. What is the yield curve? A. It is a graph that plots the yield on a particular bond against the term to maturity and for one particular issuer. So, for example, if you take the UK gilt market, the UK government is the issuer and it has got many different bonds at different maturities, ranging from just a few months to 50 years, and there are all different yields. The yield curve plots a line through all of those different yields. If you take the UK, for example, at the moment, it is an upward-sloping yield curve. It is a classic textbook-shaped yield curve. It will start yields at ...
To continue reading this article...
Join Professional Adviser for free
Signup and gain exclusive members-only insights
- Unlimited access to real-time news, industry insights and market intelligence
- Stay ahead of the curve with spotlights on emerging trends and technologies
- Receive breaking news stories straight to your inbox in the daily newsletters
- Make smart business decisions with the latest developments in regulation, investing retirement and protection
- Members-only access to the editor’s weekly Friday commentary
- Be the first to hear about our events and awards programmes