
Key points
In the US - the largest contributor to global equity markets - shares have risen more than 20% since hitting a trough in mid-October 20221 - and have roughly doubled in value since their pandemic-induced low of March 20202. The extent and pace of the gains are enough to make wary investors wonder: what will drive future performance in the US stock market?
Vanguard research suggests opportunity in value shares—marked by lower prices in relation to their enterprise book or accounting values, lower expected and historical growth rates and relatively high dividend yields.
We've been here before—not long ago
The value/growth relationship is at an extreme, and very similar to 2020. Now, as then, investors in aggregate are very enthusiastic about growth shares—notably, technology shares—and seem to have limited interest in value shares, including financial, industrial and health care companies.
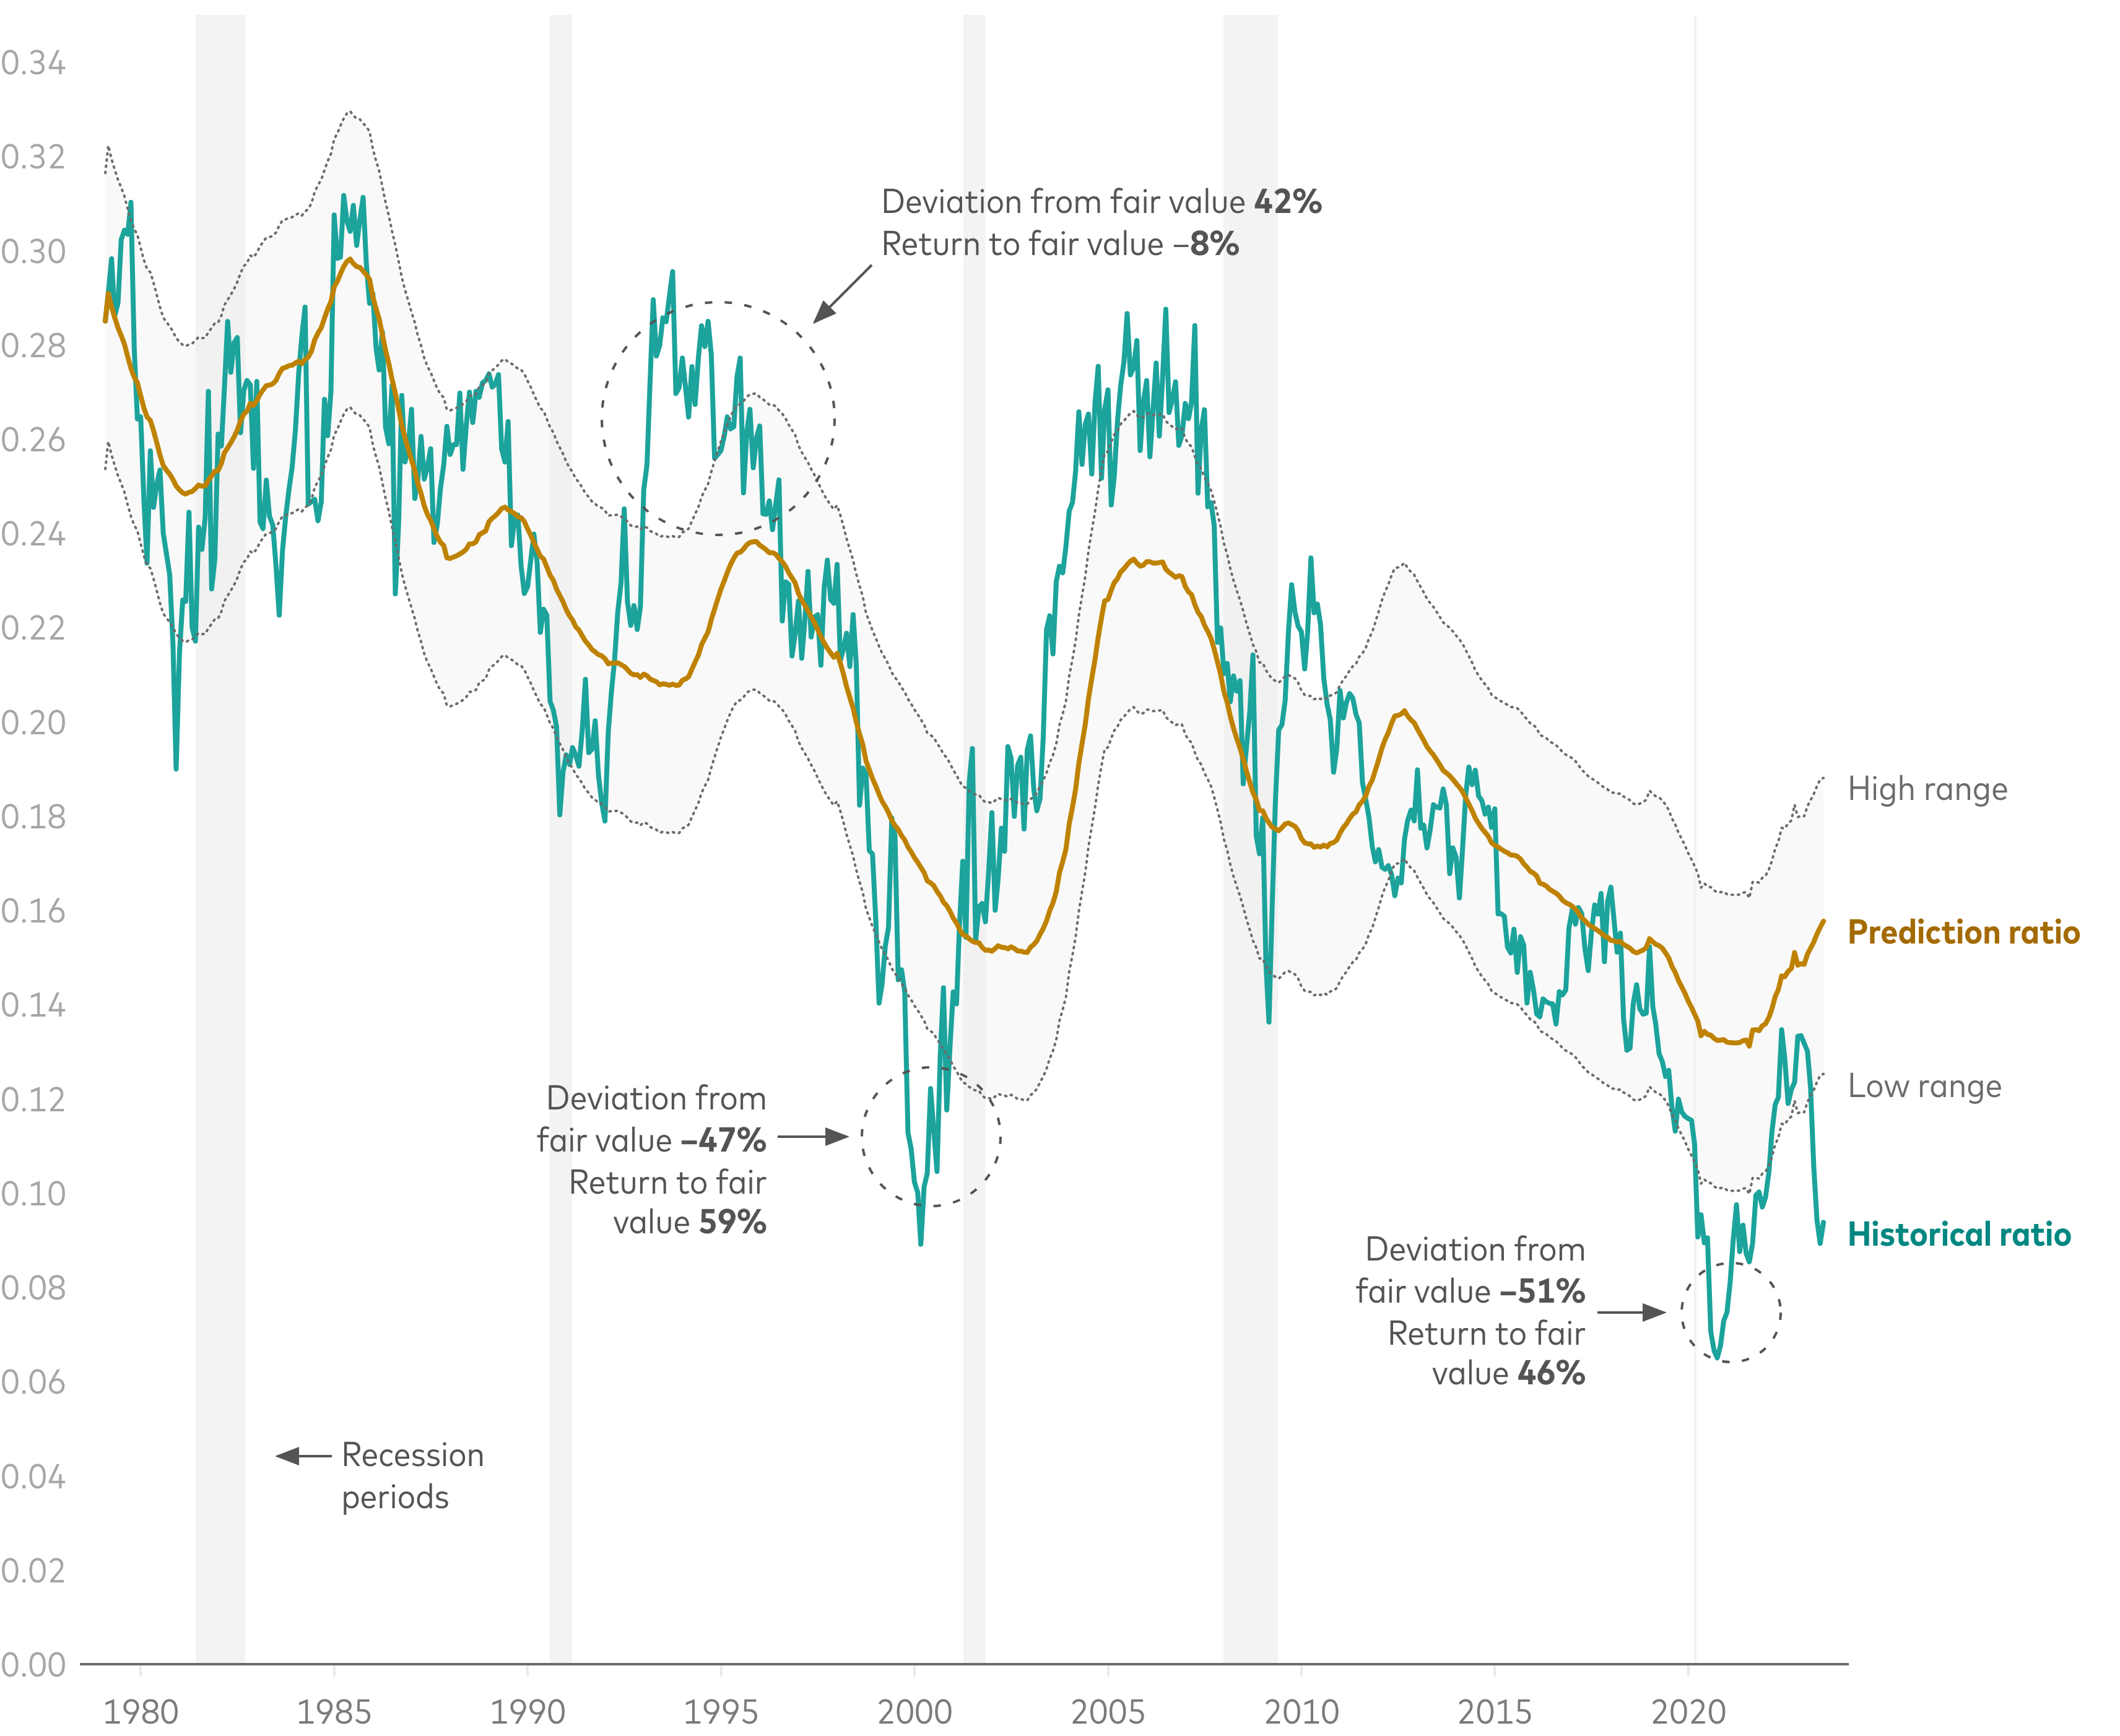
The chart below presents our estimates of the fair value of US value shares relative to US growth shares3. When the historical ratio exceeds the upper limit of our estimated fair-value range, the chance for market-beating returns appears to be larger in growth shares. When that ratio is below the lower limit of the range, such opportunity appears to be larger in value shares.
US value shares appear depressed, even in the context of a long-running decline in their relative value
Value shares' aggregate price/book ratio divided by growth shares' aggregate price/book ratio
Past performance is no guarantee of future returns. The performance of an index is not an exact representation of any particular investment, as you cannot invest directly in an index.
Notes: To assess the performance of investable value and growth portfolios, we constructed market-capitalisation-weighted indices of companies in the bottom and top thirds of the Russell 1000 Index, sorted by price/book ratios and reconstituted monthly. The valuation ratio is projected based on a vector error correction model (VECM) describing the statistical relationship between cointegrated time series. The VECM is a dynamic model of the first differences of the variables used in the cointegrating regression that includes a disequilibrium term to correct deviations from the long-term equilibrium. Monthly data are calculated in USD for the period 31 January 1979- 30 June 2023.
Sources: Vanguard (methodology and calculations, based on data from FactSet Research Systems) and the National Bureau of Economic Research (for US recession dates).
The chart highlights the returns that value shares recorded, relative to growth shares, in the wake of three of their most extreme valuations:
- Following an overvaluation in 1993, value shares underperformed growth shares by a cumulative 8 percentage points on their way back to our predicted ratio (the median of our estimated fair-value range). It took three years to get there.
- An undervaluation near the peak of the tech bubble in 2000 preceded an instance of value outpacing growth by 59 percentage points before reaching fair value in about a year.
- In 2020, another undervaluation preceded a return advantage of 46 percentage points over about 20 months. Value shares never quite got back to our median fair-value estimate before sagging again to a similar state of investor apathy.
It's well-known, as our chart suggests, that asset prices can stray meaningfully from perceived fair values for extended periods. However, deviations from fair value and future relative returns share an inverse and statistically significant relationship over five- and 10-year periods.
Our outlook for value shares
Since we issued our 2023 economic and market outlook, our forecast of the return advantage for US value shares over US growth shares has risen by more than 1 percentage point, to 3.8 percentage points, annualised, over a 10-year period4.
This reflects the rotation back to growth shares this year. Indeed, following a rebound in the relative performance of value shares in the latter stages of 2021 and 2022, value shares have lagged growth shares across the US market's capitalisation spectrum in 2023. The Russell 3000 Growth Index, for example, returned 32% in USD year-to-date as at 31 July 2023—more than three times the 9% return of the Russell 3000 Value Index.
There may be an economic case for value shares beyond valuations
Market performance across the dozen US business cycles since 1980 suggests another potential reason for optimism on value.
On average, value has outperformed during economic recoveries, historically speaking. So, if you believe that the US Federal Reserve may have engineered a soft landing—that we're going to sidestep a recession and that the economy's next move is an acceleration—the case for value as part of a balanced portfolio is strengthened.
Historically, value has shined amid economic recoveries
Average monthly return advantage of value over growth across US economic cycles
| State of the economy | Value trading above fair value | Value trading below fair value | Value's average return advantage |
| Expansion | -0.06% | 0.09% | 0.00% |
| Slowdown | -0.54% | 0.43% | -0.05% |
| Contraction | -0.28% | -0.01% | -0.12% |
| Recovery | 0.12% | 0.34% | 0.23% |
Past performance is no guarantee of future returns. The performance of an index is not an exact representation of any particular investment, as you cannot invest directly in an index.
Notes: The ‘state of the economy' terms reflect the Conference Board Leading Economic Index (LEI). LEI above trend and increasing is expansion, above trend and declining is slowdown, below trend and declining is contraction, and below trend and increasing is recovery. The underlying monthly data are in USD for the period 1 February 1979 to 30 June 2023 and include the re-investment of income.
Sources: Vanguard, based on monthly data from the Conference Board.
Investors who can look past shorter-term market cycles may benefit in the long run
To be sure, the state of the business cycle alone is an unreliable signal of the relative returns between value and growth. As shown in the table, however, when value has traded below its fair value—as it is doing today—it has historically enjoyed a performance edge in all but contractionary economic phases. Even then its shortfall relative to growth has been a scant -0.01%.
For global investors, maintaining exposure to value shares through a broadly diversified portfolio can help offset lower expected returns in other sectors of the equity markets over the next decade.
As market uncertainty persists, portfolios featuring a high level of diversification at the asset and sub-asset class levels can help buffer investors against cyclical swings and sectoral rotations, in all markets, over the long run.
The Vanguard Tough Mudder Takeover

For one day only, Vanguard will be taking over the famous Tough Mudder 5km course, to bring you, your colleagues and your peers an active day out like no other. Featuring 13 teamwork-inspired muddy obstacles jam-packed into one action-packed course, challenge yourself and your colleagues and make The Vanguard Tough Mudder Takeover your next team day out. And the best part? It's all on us.
Notes:
1 Represents change in market value of the S&P 500 Index for the period 12 November 2022 to 18 August 2023. Calculation in USD with income re-invested.
2 Represents change in market value of the S&P 500 Index for the period 23 March 2020 to 18 August 2023. Calculation in USD with income re-invested.
3 To be clear, our outlook is for the style factors, or what might be termed "pure" value and growth portfolios. These differ from both the academic definitions of value and growth popularized by Eugene Fama and Kenneth French and style-specific market indexes that serve as benchmarks for many investment portfolios.
The academic definition of value includes selling short the most expensive shares—a practice unlikely to be undertaken by the average investor. In a short sale, an investor borrows and then sells a stock in anticipation of its price declining. If the price does decline, the investor can repurchase the shares at a lower price and return them to the lender, thereby profiting. If the price rises, however, losses ensue. Regulations limit short sales.
Arguably, indexes sponsored by such firms as FTSE Russell do a good job of representing active managers' security selections. That doesn't make them ideal representations of the style factors themselves. For example, roughly 30% of Russell 1000 Index constituents appear in both the growth and value indexes, while the remaining 70% are classified exclusively as growth or value. In our view, a share thought to represent a style factor should—for analytical purposes, at least—represent only one style. In our model, a company can be deemed only value or growth in any given month, though its classification may vary over time.
4 Based on return forecasts for US value and US growth shares in the Vanguard Economic and Market Outlook 2023 and our latest forecasts in the Vanguard Economic and Market Update for August 2023. In absolute terms, our median forecast is for US value shares to return 5.6%, annualised, over the coming decade.
Investment Risk Information
The value of investments, and the income from them, may fall or rise and investors may get back less than they invested.
Past performance is not a reliable indicator of future results.
Important Information
For professional investors only (as defined under the MiFID II Directive) investing for their own account (including management companies (fund of funds) and professional clients investing on behalf of their discretionary clients). In Switzerland for professional investors only. Not to be distributed to the public.
The information contained in this document is not to be regarded as an offer to buy or sell or the solicitation of any offer to buy or sell securities in any jurisdiction where such an offer or solicitation is against the law, or to anyone to whom it is unlawful to make such an offer or solicitation, or if the person making the offer or solicitation is not qualified to do so. The information in this document does not constitute legal, tax, or investment advice. You must not, therefore, rely on the content of this document when making any investment decisions.
The information contained in this document is for educational purposes only and is not a recommendation or solicitation to buy or sell investments.
The Russell indices and Russell® are registered trademarks of Russell Investments and have been licensed for use by The Vanguard Group, Inc. The Product(s) are not sponsored, endorsed, sold or promoted by Russell Investments and Russell Investments makes no representation regarding the advisability of investing in the Products.
Issued in EEA by Vanguard Group (Ireland) Limited which is regulated in Ireland by the Central Bank of Ireland.
Issued in Switzerland by Vanguard Investments Switzerland GmbH.
Issued by Vanguard Asset Management, Limited which is authorised and regulated in the UK by the Financial Conduct Authority.
© 2023 Vanguard Group (Ireland) Limited. All rights reserved.
© 2023 Vanguard Investments Switzerland GmbH. All rights reserved.
© 2023 Vanguard Asset Management, Limited. All rights reserved.